Home
Wells Fargo 01/21 Puts : Visualizing P/L with J
Wells Fargo (NYSE: WFC) is an interesting candidate for writing put options these days. Besides the pandemic, the main contributor to its current volatility appears to be the uncertainty surrounding the asset cap that was punitively placed on Wells by the Fed following Wells’ account fraud scandal. The cap is cutting into Wells’ earnings ability, and reputationally they will continue to suffer for the forseeable future.
It’s likely that Wells’ valuation will remain depressed, to some degree, for the next year or two. But the fundamentals still look solid to me. The asset cap will eventually be removed and the scandal will fade.
I’d be willing to hold Wells for at least a year, ignoring near-term volatility and sitting on it long enough to see the asset cap removed. The stock is currently trading at $24.69. Before the pandemic it was trading around $50.
A position could be initiated today by buying the stock outright at $24.69, but that would be unfun. I’ve been wanting to play around with the J language’s plotting library, so let’s sell a put instead. Plus, the volatility around Wells is high enough at the moment that premiums are correspondingly interesting:
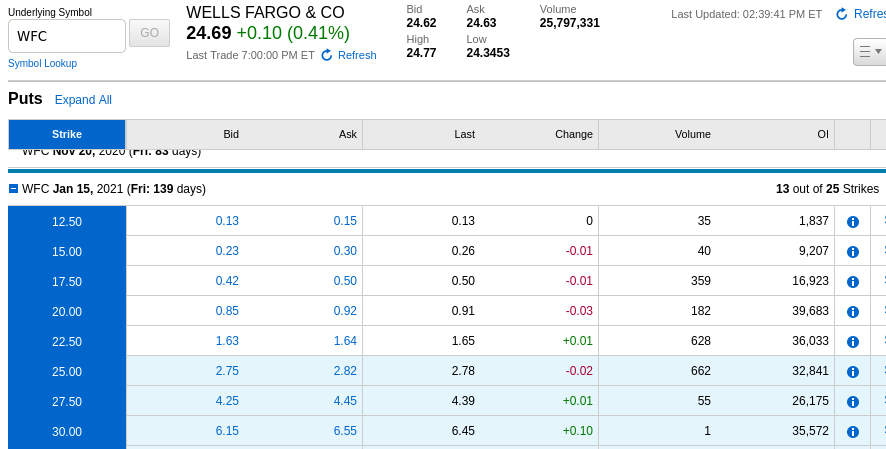
I’m choosing to focus on January 2021 here because it’s far enough out to make things interesting, but not so far out to require maintenance of over $2k in cash waiting for a potential assignment until 2022 (for a covered put).
If the spread between current and fair price was tighter, the out-of-the-money $20.00 or $22.50 strikes would be my preference. But there’s enough distance to fair price as it stands, and I’m not averse to the buyer assigning Wells to me via exercise. I think the in-the-money $27.50 strike is a reasonable choice here.
Here’s some J that generates a graph comparing the profit/loss outcomes from purchasing Wells common stock outright versus selling the January 27.50 puts:
require 'plot'

steps=: {. + (1&{ - {.) * (i.@>: % ])@{:

shares =. 100
premium =. 4.25
strike =. 27.50

x=. steps 0 60, 60
base_pl =. (x - strike) * shares
put_pl =. (premium * shares) + shares * ((x <. strike) - strike)
y =. 2 61 $ base_pl , put_pl

pd 'ycaption Profit/Loss at Expiration (USD)'
pd 'xcaption WFC Stock Price at Expiration (USD)'
pd 'key "WFC common" "WFC 01/15/2021 27.50 P"'
pd 'keypos ro;keystyle c'
pd 'title Profit/Loss of WFC Stock Purchase vs January 27.50 Put at Expiration'
pd 'type line'
pd 'type marker'
pd x;y

pd 'output pdf'
pd 'show'
When you run the above, you’ll see the following plot:
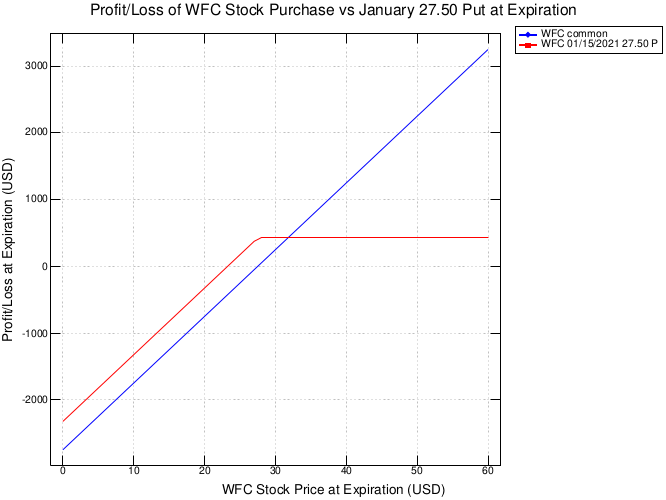
I think it’d be interesting to expand this so as to be able to compare options chains across a set of securities. One could also provide a time horizon, a premium threshold, and a strike cap, the latter of which would limit the amount of cash needed to keep the put covered. By running the code dynamically over recent end-of-day data, one could identify a set of attractive options up front fitting the provided parameters, and then delve into each underlying security to research whether a long position would be worthwhile. Right now I have to run the process in reverse, i.e. research the security first and then its options, which is a waste of time because more often than not either premiums and/or volumes leave something to be desired.
Perhaps this is why God gave us the Bloomberg terminal.